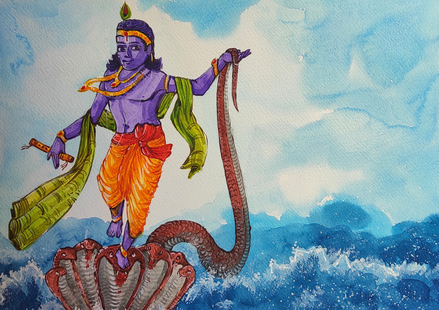
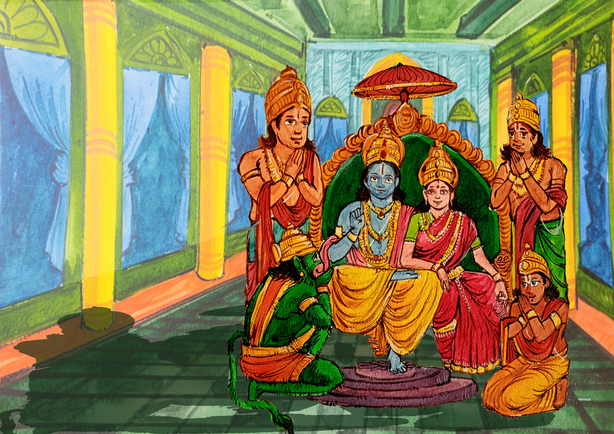
Analyse Get CAS
Free · No signup required

Know your
real returns.

Upload your CAMS statement. See XIRR, benchmark alpha, asset allocation, health checks, and exit load analysis — instantly.

1

Upload your CAS PDF

Password-protected file from CAMS or MFCentral

2

We parse & crunch

Transactions matched to AMFI NAV data in real-time

3

See your full dashboard

Performance, health checks, exit loads — fund by fund

Processed in real-time. Never stored.

01 — Portfolio summary

Your money,
at a glance

Total portfolio value, net investment, profit/loss, and true annualised returns (XIRR) — computed from every single transaction in your CAS.

Period shown on each card so you know exactly what timeframe you're looking at.

Portfolio value

₹1.24 Cr

Net invested

₹86.4 L

Profit / Loss

₹37.6 L

over 6.2 years

XIRR

14.2%

annualised, 6.2 years

02 — Asset allocation

Where your
money sits

Doughnut breakdown across Equity, Debt, Commodities, and Hybrids — with XIRR per category. Sub-category drill-down included.

Equity 68%
Debt 18%
Hybrid 10%
Commodity 4%

03 — Benchmark & alpha

Are you actually
beating the market?

Every fund compared against its category benchmark (9 TRI indices). See alpha at fund level — which picks are earning their keep and which are dragging you down.

"What if" scenarios: what if you'd put everything in Nifty 50, Nifty 500, or Gold?

Fund alpha vs benchmark

HDFC Mid
+4.2%
Axis Small
+2.8%
SBI Blue
+0.6%
ICICI Pru
-1.4%
Nippon Lg
-3.1%

04 — Year-on-year returns

How each
FY played out

Financial year returns (Apr–Mar) plotted alongside Nifty 50, Nifty 100, and Nifty 500. Full years use XIRR; partial years show absolute returns for a fair comparison.

Up to 10 financial years of history. Best/worst FY highlighted.

FY returns vs benchmarks

21-22
22-23
23-24
24-25
Your portfolio Nifty 500

05 — Portfolio health check

Issues that
need your attention

Automated checks for missing nominees, regular-plan commission leakage, SIP gaps, fund overlaps, dormant folios, and more — prioritized by severity.

Nominees SIP tracking Fee check Duplicates Overlaps Switches

Missing nominee declaration

3 of 12 active funds have no nominee. SEBI mandates this.

Regular plan commission leakage

5 funds paying ~₹12,400/yr in hidden commissions.

Stopped SIPs detected

2 SIPs appear inactive. Review if intentional.

06 — Exit load analysis

What's locked,
and until when

Exit load rules are extracted directly from your CAS PDF. We replay every purchase on a FIFO basis to show exactly which funds have units still under lock-in, the value at risk, and the date they become free.

Locked value

₹18.4 L

Funds locked

7

Portfolio

14.8%

Fund Locked Free on
Axis Global Innov... ₹8.2 L 18 Sep 2026
HDFC Focused... ₹5.1 L 03 Jan 2027
SBI Small Cap... ₹3.4 L 12 Nov 2026

07 — SIPs & nominee tracking

Your SIPs and
nominee coverage

Active vs stopped SIP breakdown with monthly amounts and gap detection. Nominee coverage with a chart showing how much value each nominee covers — and how much is "at risk" without one.

Auto investments

8 Active · ₹1.25 L/mo
3 Stopped

Nominee coverage

Covered · ₹1.04 Cr
At risk · ₹20.2 L

08 — Fund-by-fund detail

Every fund,
every metric

Complete table with each fund's value, net flow, XIRR, benchmark XIRR, and alpha. Sorted by value. Numbers in Crores and Lacs for easy reading.

Organized across three tabs: Performance, Yearly, and Health Checkup.

Performance
Yearly
Health
Fund Value XIRR Alpha
HDFC Mid-Cap Opp... 22.4 L 18.6% +4.2%
Axis Global Innov... 20.1 L 15.1% +2.8%
SBI Nifty 50 Index... 14.8 L 12.2%
ICICI Pru Value Dis... 8.3 L 9.4% -1.4%

Zero data retention

Your PDF is parsed in memory and discarded immediately. No accounts, no tracking, no database storage. We never see your password.

Don't have your CAS?

Download your Consolidated Account Statement from CAMS or MFCentral in under 5 minutes. Completely free.

Step-by-step guide